BoldSign Developer Console: Monitor API Logs, Debug Faster, and Ship with Confidence
 Mohan Ravi
TL;DR: The BoldSign Developer Console is a log of the API requests your account sends and the responses it gets back. You can filter it to find a failed call, read its details and download the logs. Our eSignature API page covers what you can build with it.
A document send fails in your app, and the error message says little. Without a record of the call, you change one thing at a time and hope it was the fix.
The Developer Console gives you that record. You see what your code sent, what we sent back and the status code, so you can fix the real cause. This post first appeared in August 2026 to announce the console, and we updated it in November 2026.
What is the BoldSign Developer Console?
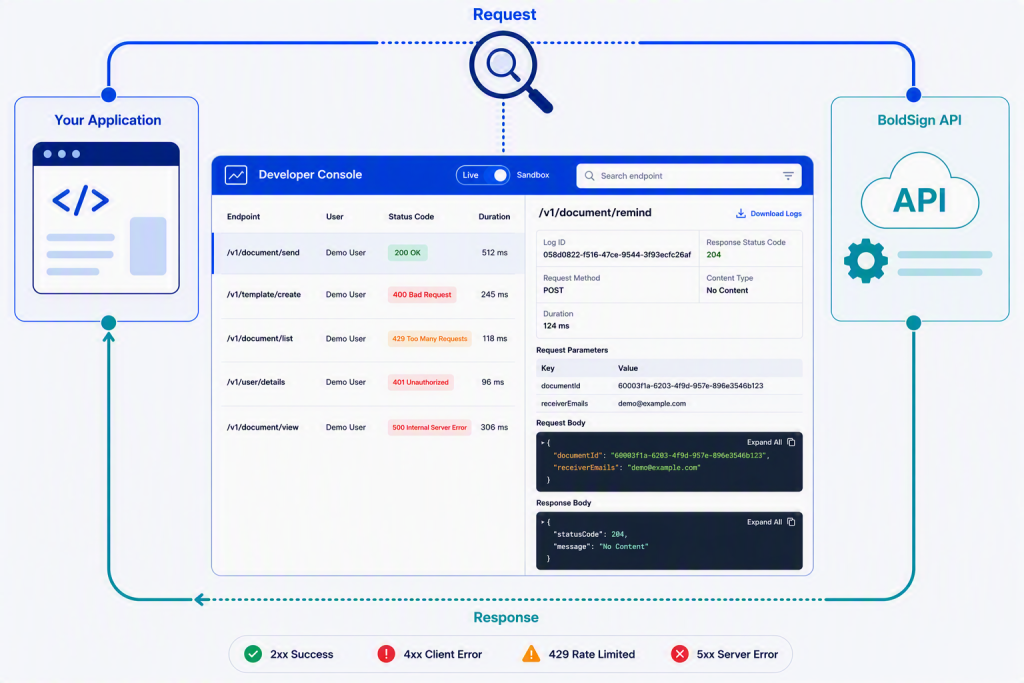
The Developer Console is a page in the BoldSign web app that lists API calls made on your account. Each entry shows what was sent, what came back and whether it worked.
Think of it like a flight recorder for your integration. When something goes wrong, you replay what happened instead of guessing. You will open it most often while you:
- Set up a new integration and test it in sandbox.
- Check a failed request against what the documentation expects.
- Share the details of a problem with our support team or a colleague.
How does the Developer Console help with a signature API integration?
A signature API integration sends documents, templates and status checks to us from your own code. The console shows each of those calls, so you can see which one broke.
The console does not teach you how to build a call. Our Developer Hub covers concepts and setup. The Swagger user interface (UI) lets you build and try a request from scratch.
| Tool | Use it when you need to |
|---|---|
| Developer Console | See requests your account already sent and what came back |
| Developer Hub | Learn how the API, authentication and webhooks work |
| Swagger UI | Try an endpoint or check the expected request format |
| Client libraries | Write the integration in your own programming language |
How do you open the Developer Console?
Sign in to the BoldSign web app, open the API section and select Developer Console. You can also go straight to the Developer Console once you are signed in.
Account admins can see API activity for every user in the organization. Our help article on how to view all API logs as an account admin shows each filter.
Why do sandbox and live logs matter?
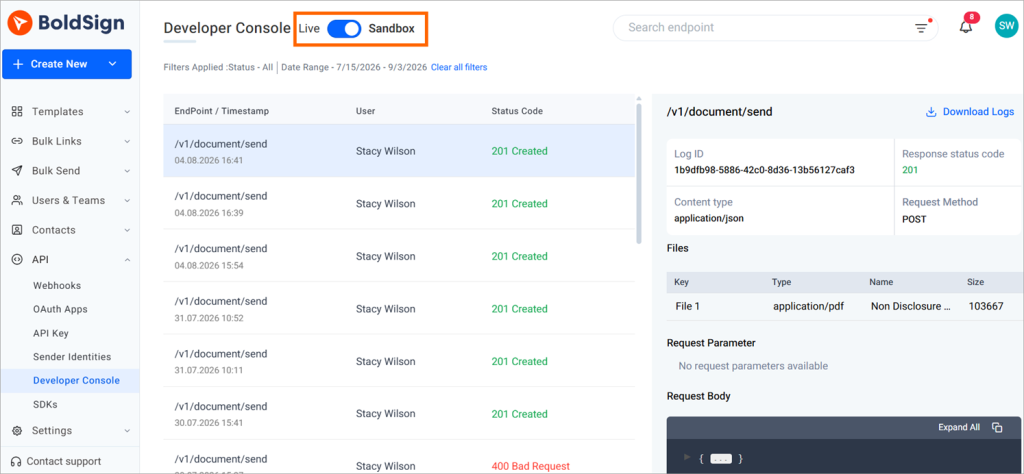
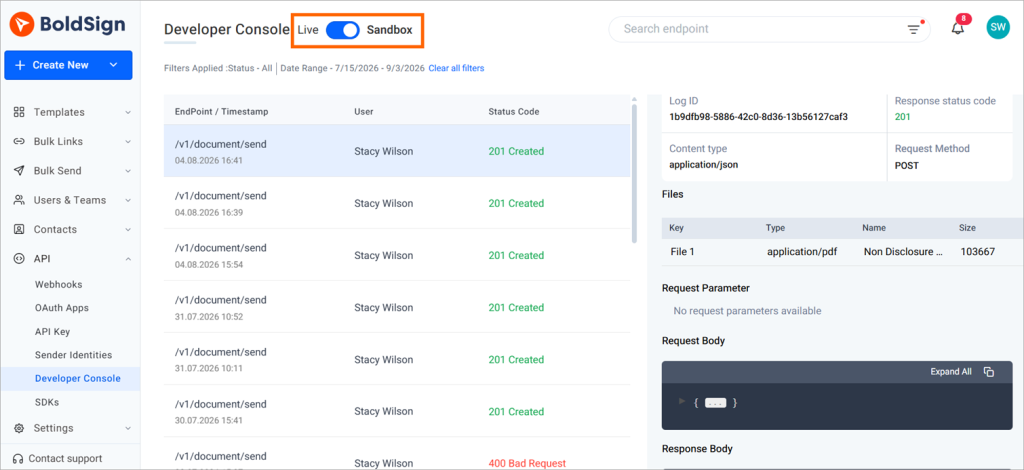
Sandbox and live logs appear separately, and a switch at the top left of the console moves between them. Many missing requests turn out to be sitting in the other environment.
Check these points before you dig into the logs:
- Your sandbox key calls sandbox, and your live key calls live.
- Your webhooks are set up in the environment you are testing.
- The console is set to the environment where the failure happened.
A free API sandbox account is the easiest place to try the console. Every test request you send appears in the Sandbox view.
What does a log entry show?
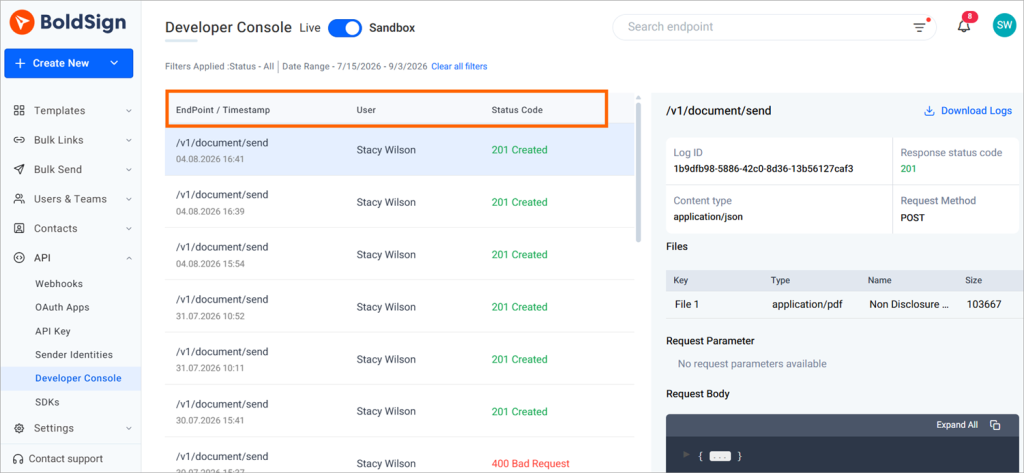
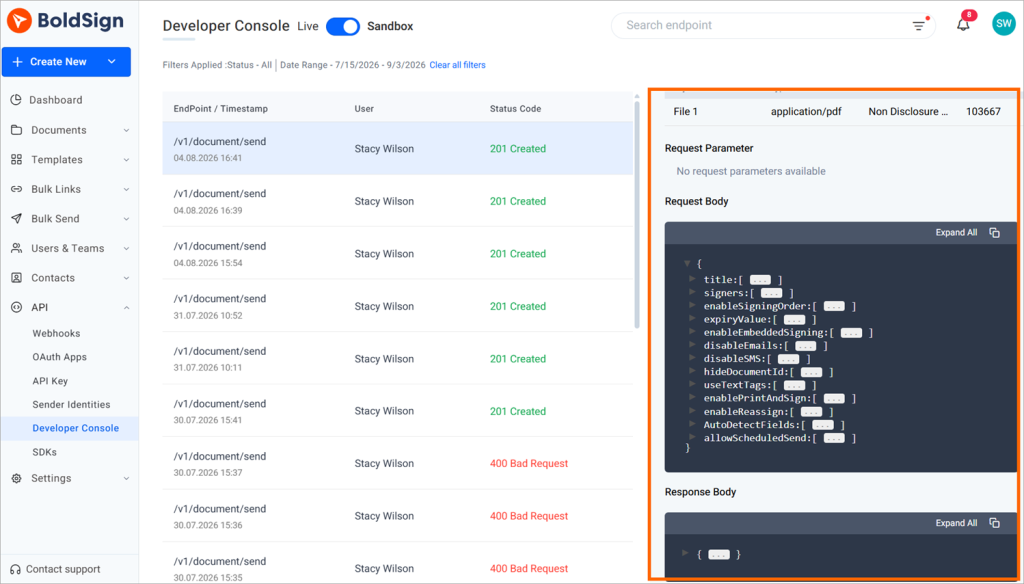
Each entry in the list shows the endpoint path, the time of the request and the status code. The path, such as /v1/document/send, tells you which action ran.
Use the time to match the call to your own application logs. The status code gives the first hint about the result:
- 2xx means the request worked.
- 4xx means a problem with the request, such as bad input or a wrong key.
- 5xx means an error on our side, so retry or contact support.
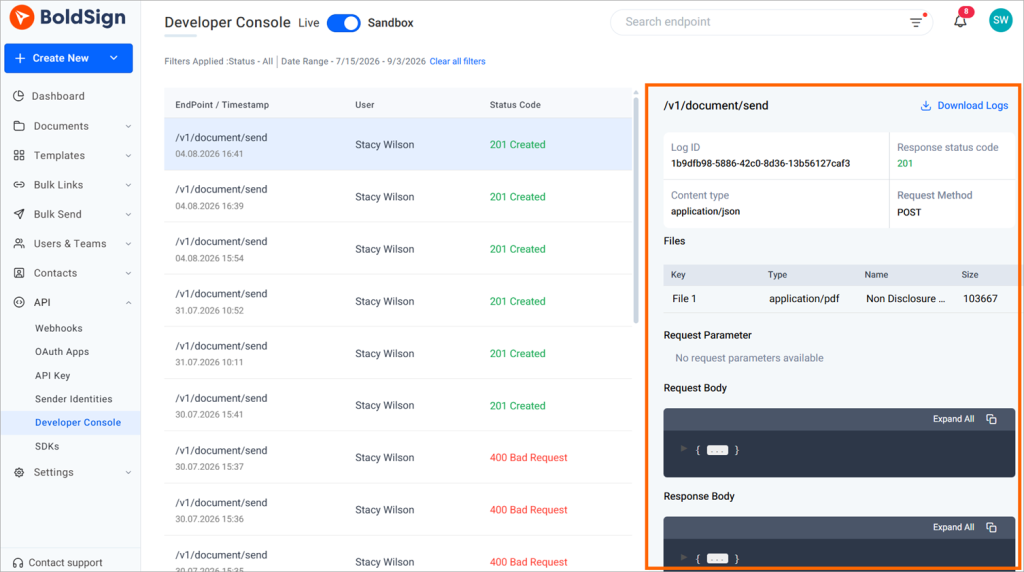
Select an entry to open its details. You see the request and response bodies, the request parameters and any uploaded file details in separate sections.
How do you find a failed request in the logs?
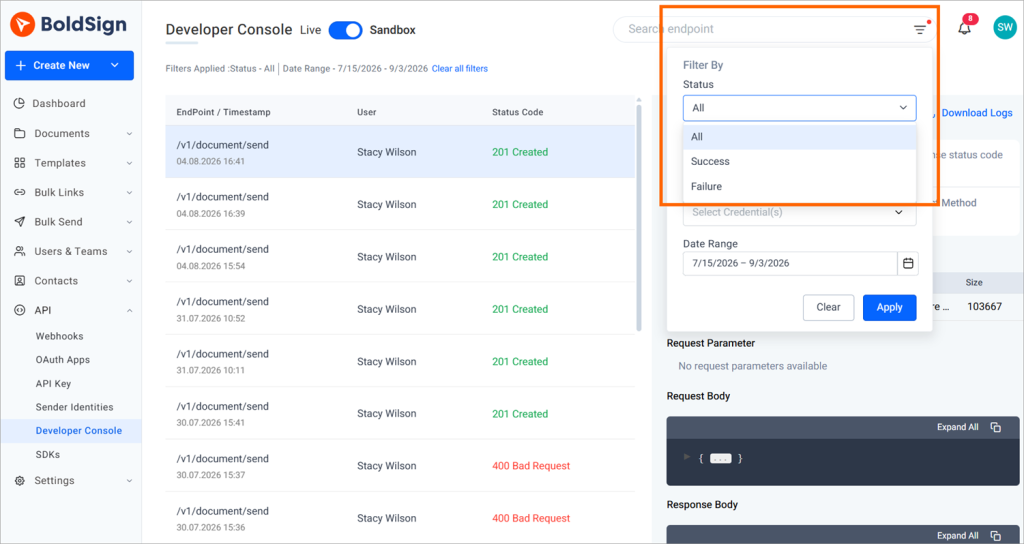
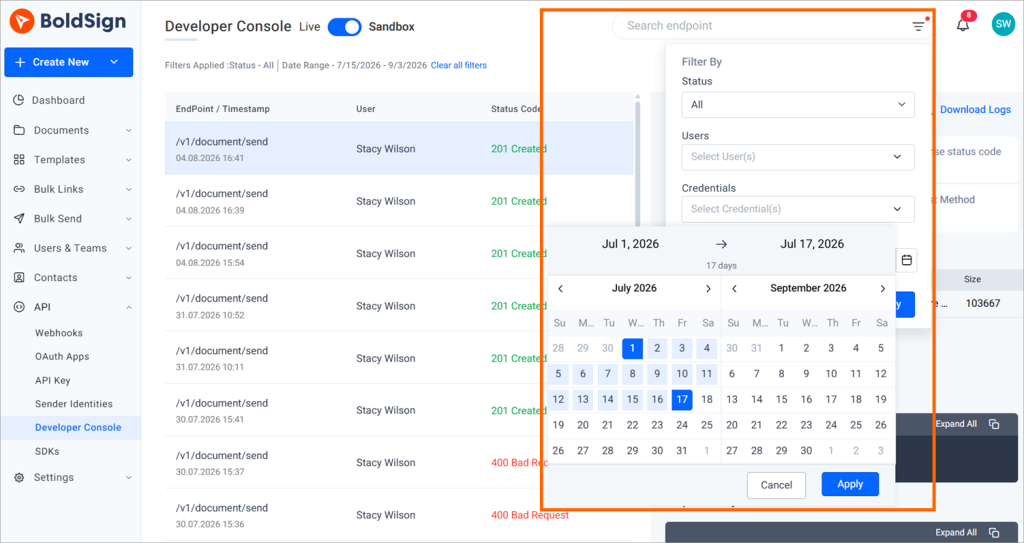
Use the filters to cut the list down to the calls that matter. Start with the environment and the status, then narrow by date.
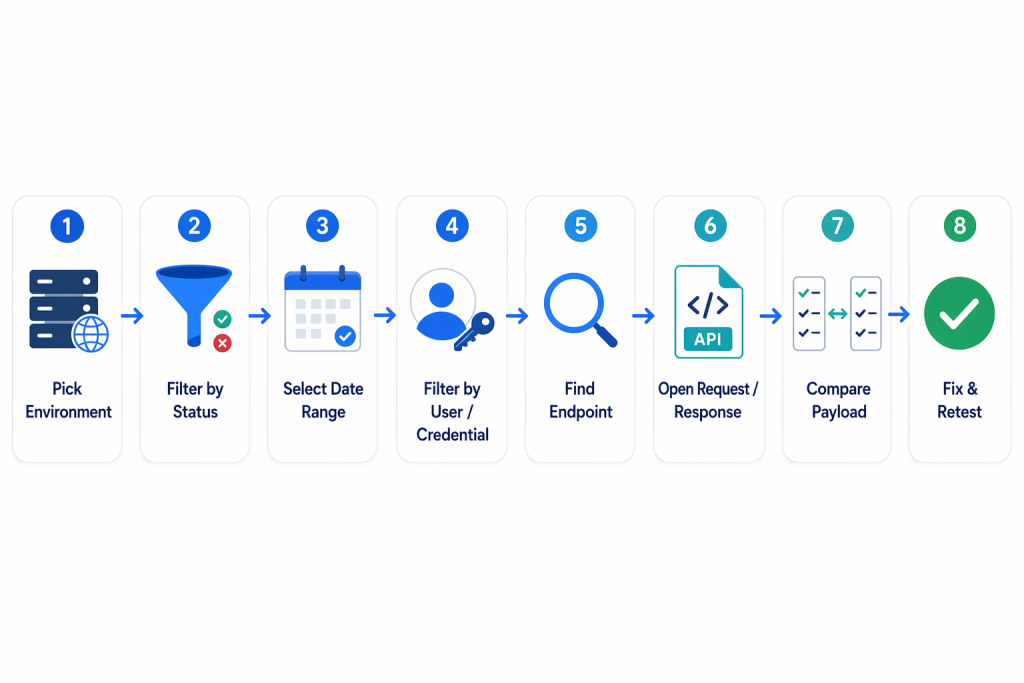
- Choose Sandbox or Live with the environment switch.
- Set Status to Failure to show only the calls that failed.
- Set the date range to the time the problem happened.
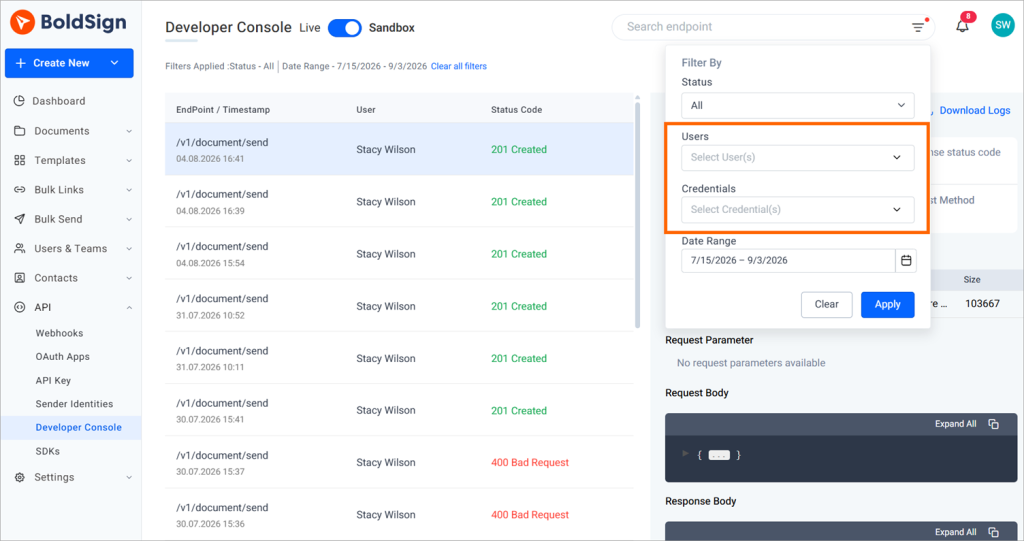
- Pick a user, then API Key or OAuth, to focus on one key.
- Find the endpoint and open the entry.
What do you do after you open the entry?
Compare what you sent with what the endpoint expects, then fix it and test again.
- Read the request and response details in the entry.
- Compare the parameters and body with the API documentation.
- Change your code and send the request again.
What causes common API errors, and how do you fix them?
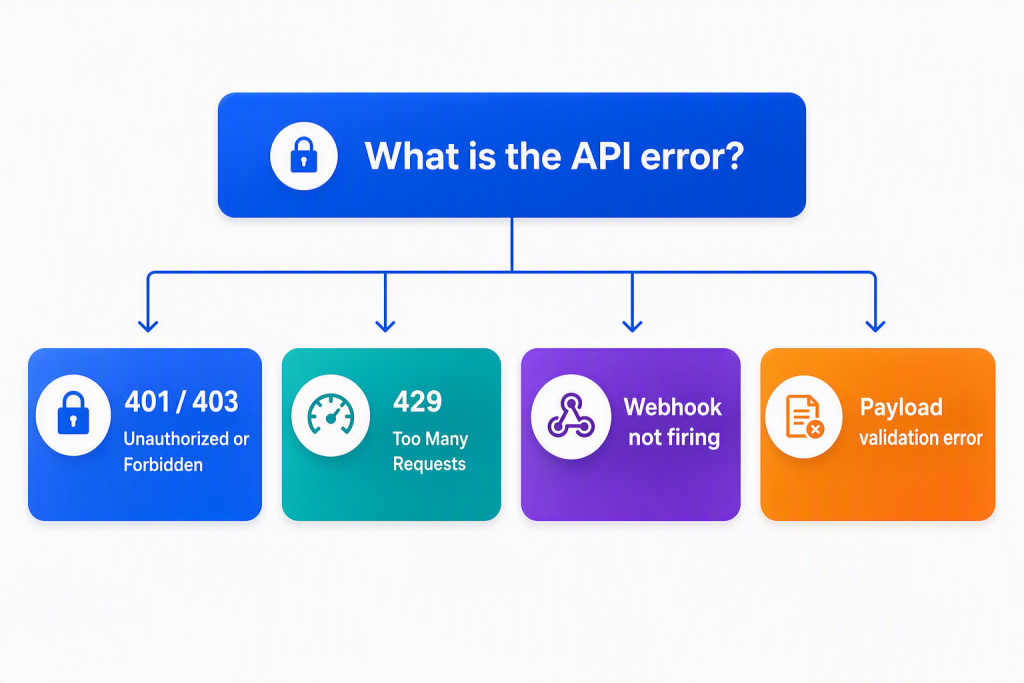
Most failures fall into four groups: access, rate limits, webhooks and payload errors. The status code in the log tells you which group to check.
401 Unauthorized or 403 Forbidden
A 401 or 403 status points to access, not to your logic. Look for an expired key, a sandbox key calling live, or a missing permission.
Check that the key is active and in the right environment. For OAuth, compare your flow with the authentication documentation. Our guide to API keys and OAuth explains how the two differ.
429 Too Many Requests
A 429 status means your account went over its hourly request limit. Our rate limit documentation sets 50 requests per hour in sandbox and 2,000 per hour in live.
Cut repeated status checks and use webhooks where you can. Space out retries with a growing wait between them. Our guide to API rate limiting explains why limits exist and how to plan for them.
Webhook not firing
Start by checking the environment, since a webhook only fires in the environment where you set it up. Then confirm the webhook URL is correct.
Next, find the API call that should have triggered the event. The log shows whether that call worked.
Payload validation errors
Open the request body in the console and compare it with the schema in Swagger UI, field by field. Look for missing required fields and values of the wrong type.
Seeing the body you sent next to the expected schema usually shows the gap quickly.
How do you export logs to share with support?
Select Download logs to save the logs as a JavaScript Object Notation (JSON) file. The file holds the request, response and file data.
Use the file to send a failure to our support team, write up an incident or reproduce a customer’s bug. Check the file before you send it anywhere:
- Remove personal data and business details you do not need to share.
- Remove any active API key or access token.
- Send it only through a channel your company trusts.
Which plan do you need for the Developer Console?
You can try the console for free with a sandbox account. Live API calls need our Enterprise API plan.
Every web app plan includes sandbox API access, so you can test requests and read their logs. The Enterprise API plan starts at $30 a month with 40 envelopes, and each extra envelope costs $0.75. Prices are in USD.
Live API access, webhooks and embedded signing come with that plan. See the API pricing page for current details.
Where do you go next with the Developer Console?
Sending one request and reading its log shows you how the console works. Pick a next step:
- Create a free API sandbox account and send your first document.
- Book a demo to see the console with your own use case.
- Read about webhook events from your app or account to plan your updates.
Frequently asked questions
Where do I find the BoldSign Developer Console?
Sign in to the BoldSign web app, open the API section and select Developer Console. You can also open app.boldsign.com/api-management/developer-console once you are signed in.
Can an account admin see API calls made by other users?
Yes. An account admin can pick one user, several users or All in the Users filter to see API activity across the organization.
Can I filter logs by API key or OAuth?
Yes. Choose a user first, then pick API Key, OAuth or All in the Credentials filter. The list then shows only calls made with those credentials.
Can I download the API logs?
Yes. Select Download logs to save them as a JSON file. The file holds the request, response and file data, so check it for private data before you share it.
Why can't I find a request I just sent?
Check the environment switch first. Sandbox and live logs appear separately, so a request sent with a sandbox key shows only when the console is set to Sandbox.
What does a 429 error mean in the BoldSign API?
A 429 Too Many Requests error means the account went over its hourly limit. Sandbox allows 50 requests per hour and live allows 2,000 per hour.
Is the Developer Console the same as Swagger UI?
No. Swagger UI lets you build and try a request from scratch. The Developer Console shows requests your account has already sent and what came back.
Can I use the Developer Console without a paid plan?
Yes. A free API sandbox account lets you send test requests and read their logs in the console. Live API calls need the Enterprise API plan.

Mohan Ravi
A seasoned tech enthusiast with over 5 years of hands-on experience in the ever-evolving world of software development. From mastering the intricacies of .NET to harnessing the power of JavaScript, Mohan’s expertise extends across the realms of full-stack development. A true problem-solver and a passionate coder at heart, he is always eager to explore new technologies and bring innovative ideas to life.
More posts by Mohan Ravi